Paper Title: A Flux Scale for Southern Hemisphere 21cm EoR Experiments
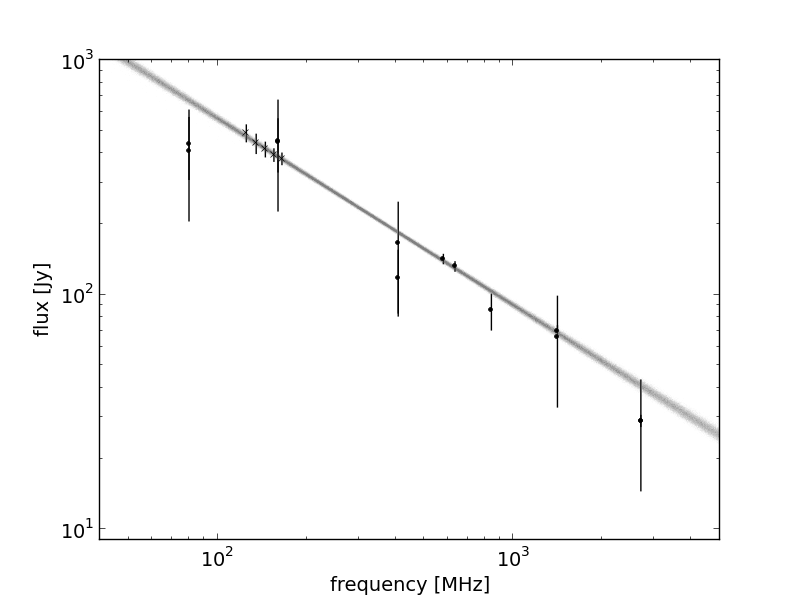
If you look at typical catalogs of sources in the southern hemisphere epoch of reionization band you soon realize why measurements often disagree by 20%. Even the brightest sources one would use for calibration are uncertain. As you can see from the plot to the right, most of the old data (dots) are pretty uncertain. This source (Pictor A) is one of the brightest in the southern sky and is often use to set the flux scale. The flux scale standard everyone uses to compare measurements is based on Cygnus A, which is not really even visible in the south, isn’t even defined at 150MHz.
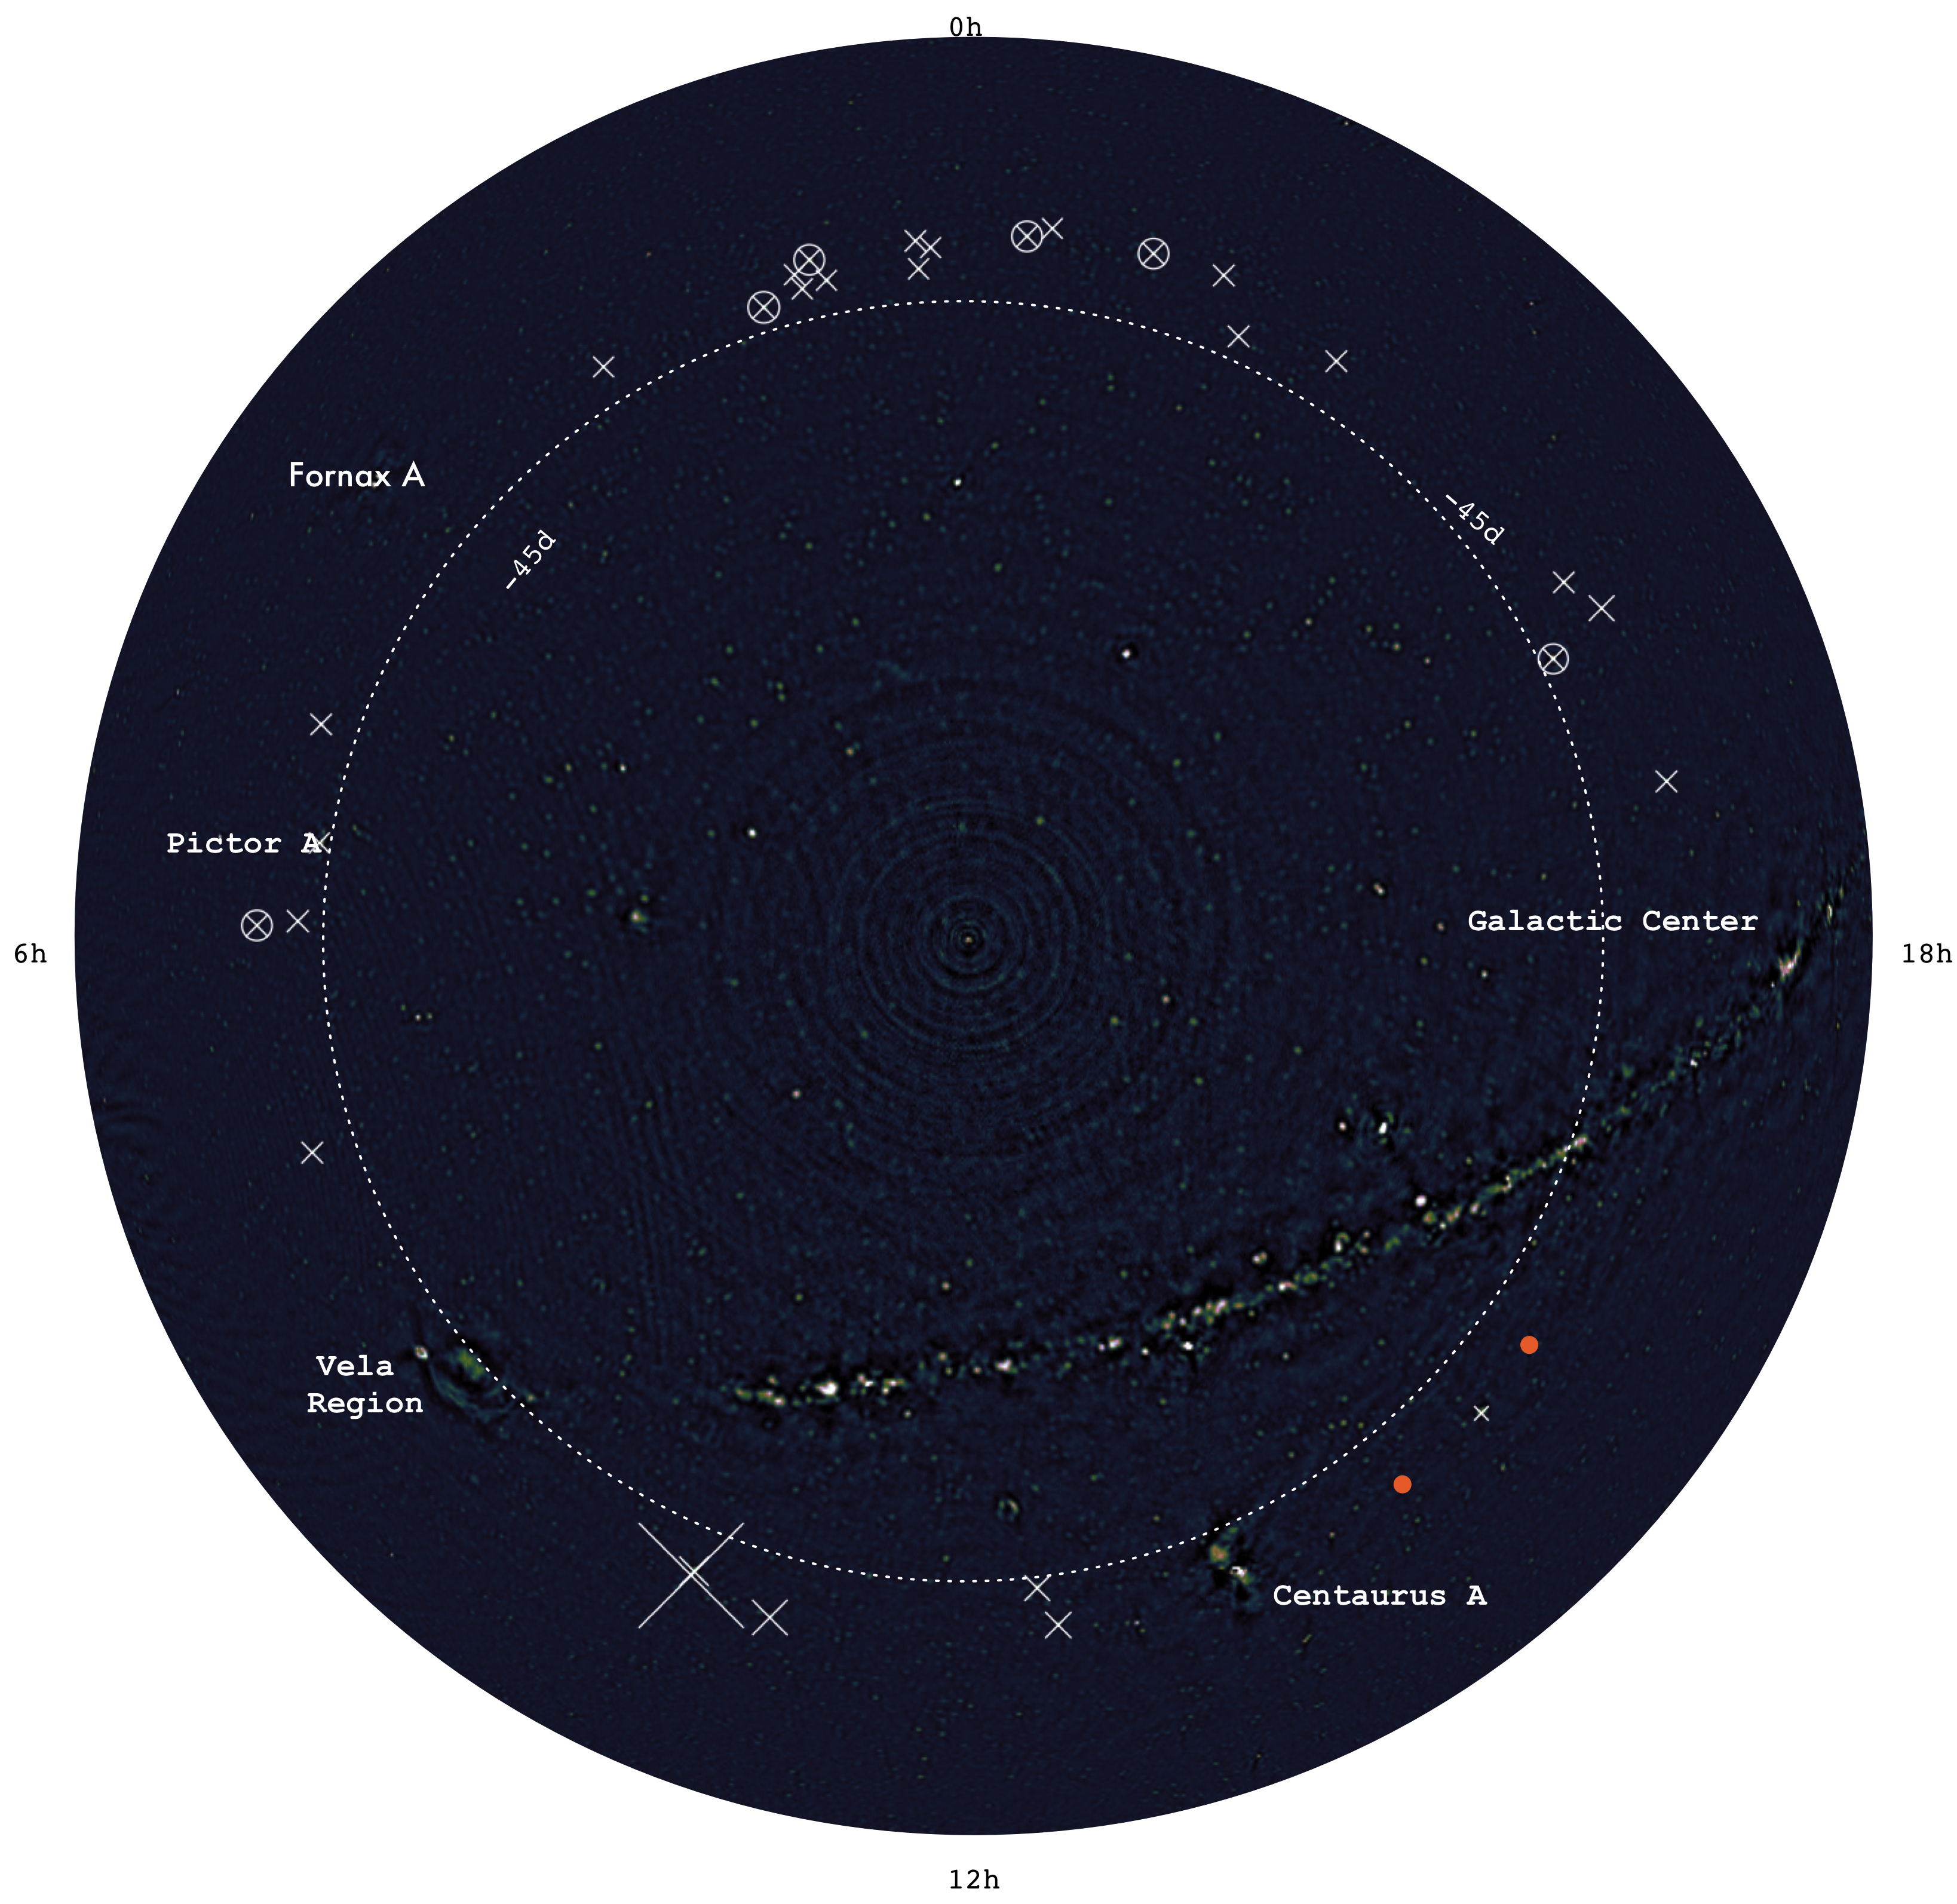
So thats why we took a bunch of PAPER data and measured a bright source (Pictor A) several thousand times. This let us get rid of a lot systematics to get a nice spectrum. Then we fit a spectrum to old and new data using newish fitting procedure that accounts for error bars and nicely estimates the fit uncertainty. Previous estimates put the model uncertainty at about 20% (that number again!) but using the new fitter on the old data we found that we could predict the flux at about the 5% level, folding in the new PAPER data the model precision went below 2%. An order of magnitude improvement! we also verified this method on a couple dozen other sources with good success. Below is a nice large PAPER image of the area we were looking at.